
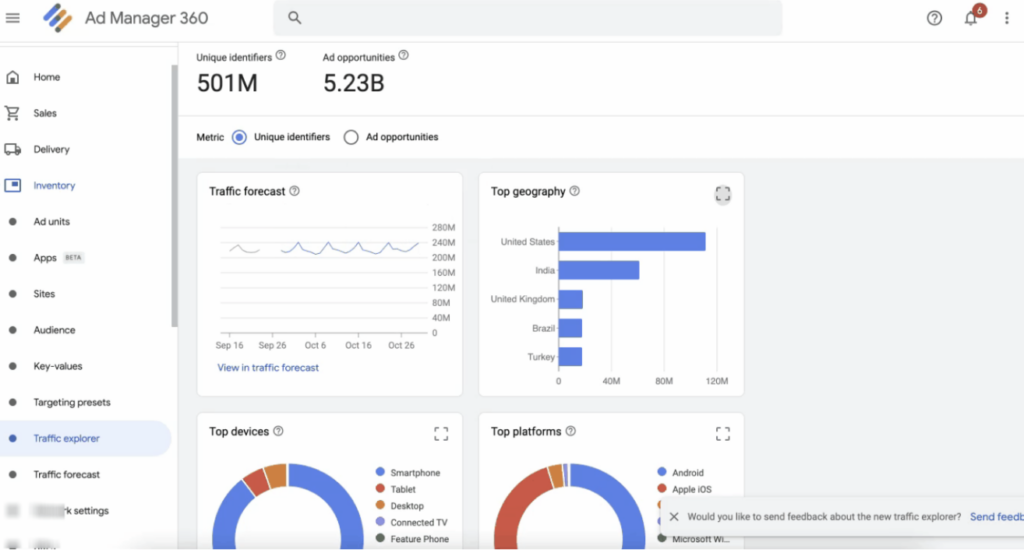
A powerful feature in Google Ad Manager provides publishers with valuable information that shows instant insights about first-party data directly from the publisher’s inventory. This feature is called Traffic Explorer. To access it, go to Google Ad Manager, click on Inventory and select Traffic Explorer.
Set your preferred report date range.
You can then click Edit targeting to segment the inventory that you are interested in exploring. Users may also configure comparison targeting if it’s necessary.
This show the number of unique identifiers that were exposed to your ad requests over a given duration. You can use this information to estimate how many people were shown your ad.
Unique identifiers aren’t the same as unique users. If your ad is shown twice on a single device, it only counts as one unique identifier.
Right next to that is Ad opportunities, which are the number of times it was possible to have delivered an impression.
Users can select between Unique identifiers and Ad opportunities. The scorecards will then update based on your selection.
Speaking of scorecards, these show an overview of audience segment reach, including ad opportunities and unique identifiers. They can be expanded for an enlarged view if needed:
Let’s explore some of them:
Traffic Forecast shows historical traffic along with future impression opportunities for a selected inventory, and sell-through rates.
- The top regions show where users in the selected audience segment are located when visiting the publisher’s site.
- Clicking a specific country allows users to see more granular data at the state or region level.
- Top devices show which devices the most ad opportunities or unique identifiers were served.
- Top browsers show which browsers users in the selected inventory are visiting your site from.
- Top platforms show which ones present the most ad opportunities or unique identifiers served.
- Top line items and ad units show which line items and ad units show the most ad opportunities or unique identifiers served
- The time of day when users visited your site.
- Individual blocks equal one hour.
- Darker blocks mean more ad opportunities.
Note that the data shown here represents an estimate based on traffic sampled over the last 30 days, so the figures might not be exact.
Data from Traffic Explorer can be effectively used for many things such as building audience segments, troubleshooting when sudden changes in the inventory occur, learning and first-data development, and many more.
When using data from Traffic Explorer, any insights gained from this feature must be used in compliance with your existing contractual obligations. This includes compliance with applicable law, Google Ad Manager platform policies, and EU User Consent Policy.
In AdOps, having reliable and intuitive reports is crucial in understanding how your optimization strategies are faring. Not only that, these data can help identify opportunities that can take your business to the next level. Talk to the ad optimization experts at MonetizeMore about the PubGuru Ad Optimization Platform and how its vast array of features and reports can help you grow your business.
source https://www.monetizemore.com/blog/uncover-ad-inventory-insights-with-google-ad-managers-traffic-explorer/

![Best Mobile Ad Sizes to implement in 2026 [Don’t miss out]](https://lh3.googleusercontent.com/blogger_img_proxy/AEn0k_tS4qybWrJGnkcT4xaMvH_7RMJUhhocBfQxcnuoLoNPqkl-CHyl2319uKJqBGi4pa5DiNXUh1_ywlolc7syK-9jtEyM2iFzlfyIwddEIKcmoiU1BA=w72-h72-n-k-no-nu)


![Best Mobile Ad Sizes to implement in 2026 [Don’t miss out]](https://lh3.googleusercontent.com/blogger_img_proxy/AEn0k_u1LG7-NPqIh0_vPPr66xp8PPI8B_1p3sdihPqQUG4IzQ8XeOOtqqXikUbTQGdVzQux6JWNVcSUywTiCJFD2ghH99-Osqn51Z_vpMHOWw3-AhYXjj17mg=w680)
![Ads with Fallacies: Avoiding the Pitfalls [10 examples included]](https://lh3.googleusercontent.com/blogger_img_proxy/AEn0k_taXk17MYn82UlEFUbdLT9YNa3FqjRo9yPCJUeQhX2opd_f2_xO4ii5wKwwh7yimnhZiRRp_nWtWnhrPHWMRMxqM2DtURgSrh7c-_vLTESb9isWn-C19XEaYkRuJdwVHuFhnrY4yaVShF9aqtvp0R5sYupSrqU=w680)


0 Comments